Gold Futures Weekly Workbook: Harmonizing Gann Square of 9 and Saturn Alignment (April 28 – May 2, 2025)

Gold Futures Weekly Workbook: Harmonizing Gann Square of 9, Options Levels, and Saturn Alignment (April 28 – May 2, 2025)


Introduction

As we step into the final trading days of April, Gold Futures (GC) are positioned at a critical point. Trading around $3,308 at the Monday open, gold has surged from recent lows and now sits at the threshold of important mathematical, psychological, and cosmic barriers.

This week’s trading landscape presents a rare and powerful harmony: the convergence of Gann Square of 9 mathematical levels from the April 22nd swing high at 3509, Options Open Interest walls, and the astrological influence of Saturn’s current position at 334°.

This workbook outlines the key price levels to watch, crafted from the union of Gann theory, real-world market positioning, and cosmic timing. It will serve as a tactical guide to navigate the gold market Monday through Friday.

Big Picture Outlook

Gold has shown strong momentum in April but is now approaching major resistance zones where institutional option positioning, Gann cycle mathematics, and planetary cycles suggest heightened volatility, potential trap setups, and major inflection points.

Expect expanded daily ranges, rapid reversals near key levels, and sharp directional moves triggered by options gamma effects and harmonic time cycles.

Major Gann Square of 9 Levels (from 3509 Swing High)

Immediate Upside Levels:

  • 3519 (15° up): Minor resistance
  • 3531 (30° up): Secondary resistance
  • 3541 (45° up): Strong resistance
  • 3552 (60° up): Mid-major resistance
  • 3563 (75° up): Inflection zone
  • 3573 (90° up): Major resistance
  • 3637 (180° up): Full secondary extension target

Immediate Downside Levels:

  • 3499 (15° down): Minor support
  • 3488 (30° down): Secondary support
  • 3478 (45° down): Strong support
  • 3466 (60° down): Mid-support
  • 3455 (75° down): Inflection support
  • 3446 (90° down): Major support
  • 3384 (180° down): Key structural support
  • 3322 (270° down): Deep cycle support

Major Options Open Interest Levels

LevelComment
3300Massive put/call cluster — critical battlefield
3250Strong put defense below
3400Heavy call wall — major upside resistance
3200Deep backup put defense

Harmonized Key Levels (Gann + Options Confluence)

These levels are where Gann projections and real-world market positioning overlap, creating maximum energy points:

LevelWhy It Matters
3322-3300Critical support/battlefield (Gann support + massive OI)
3262-3250Deep secondary support (Gann cycle + put defense)
3384-3400Major resistance/magnet zone (Gann resistance + call wall)
3499-3500Minor psychological resistance (Gann + psychological round number)

Saturn Alignment: Cosmic Harmony with Price

As of April 28, 2025, Saturn’s astrological position is approximately 334° longitude. In Gann astro-financial forecasting, planetary longitudes often create attractor zones for price.

Projecting Saturn’s 334° onto price, we find:

  • 3340 as a harmonic projection, aligning almost perfectly with the current 3300-3340 options battlefield and Gann levels.
  • This confirms 3300-3340 as an extreme magnet zone for price action this week.

If gold holds above this cosmic and mathematical attractor zone, it opens bullish potential. If it loses this zone, expect sharp downside moves.

Tactical Game Plan for the Week

Primary Bias:

  • Stay bullish above 3300-3322.
  • Expect resistance and possible short-term tops around 3384-3400.
  • Prepare for sharp liquidation if 3300 breaks decisively.

Scenarios and Reactions:

ScenarioMy Trading Plan
Gold holds 3300-3322Look for long setups targeting 3384-3400
Gold breaks 3300Target flush toward 3250-3262
Breakout over 3400Potential rally continuation, but scale profits aggressively
Rejection at 3384-3400Short-term short setups back toward 3322-3300

Timing Windows:

  • Monday-Tuesday: Likely continuation attempts and first test of 3322.
  • Wednesday-Thursday: Expect volatility spikes; strong reactions at major levels.
  • Friday: Possible profit-taking and final week reversal setups.
1HR Chart

Final Cheat Sheet

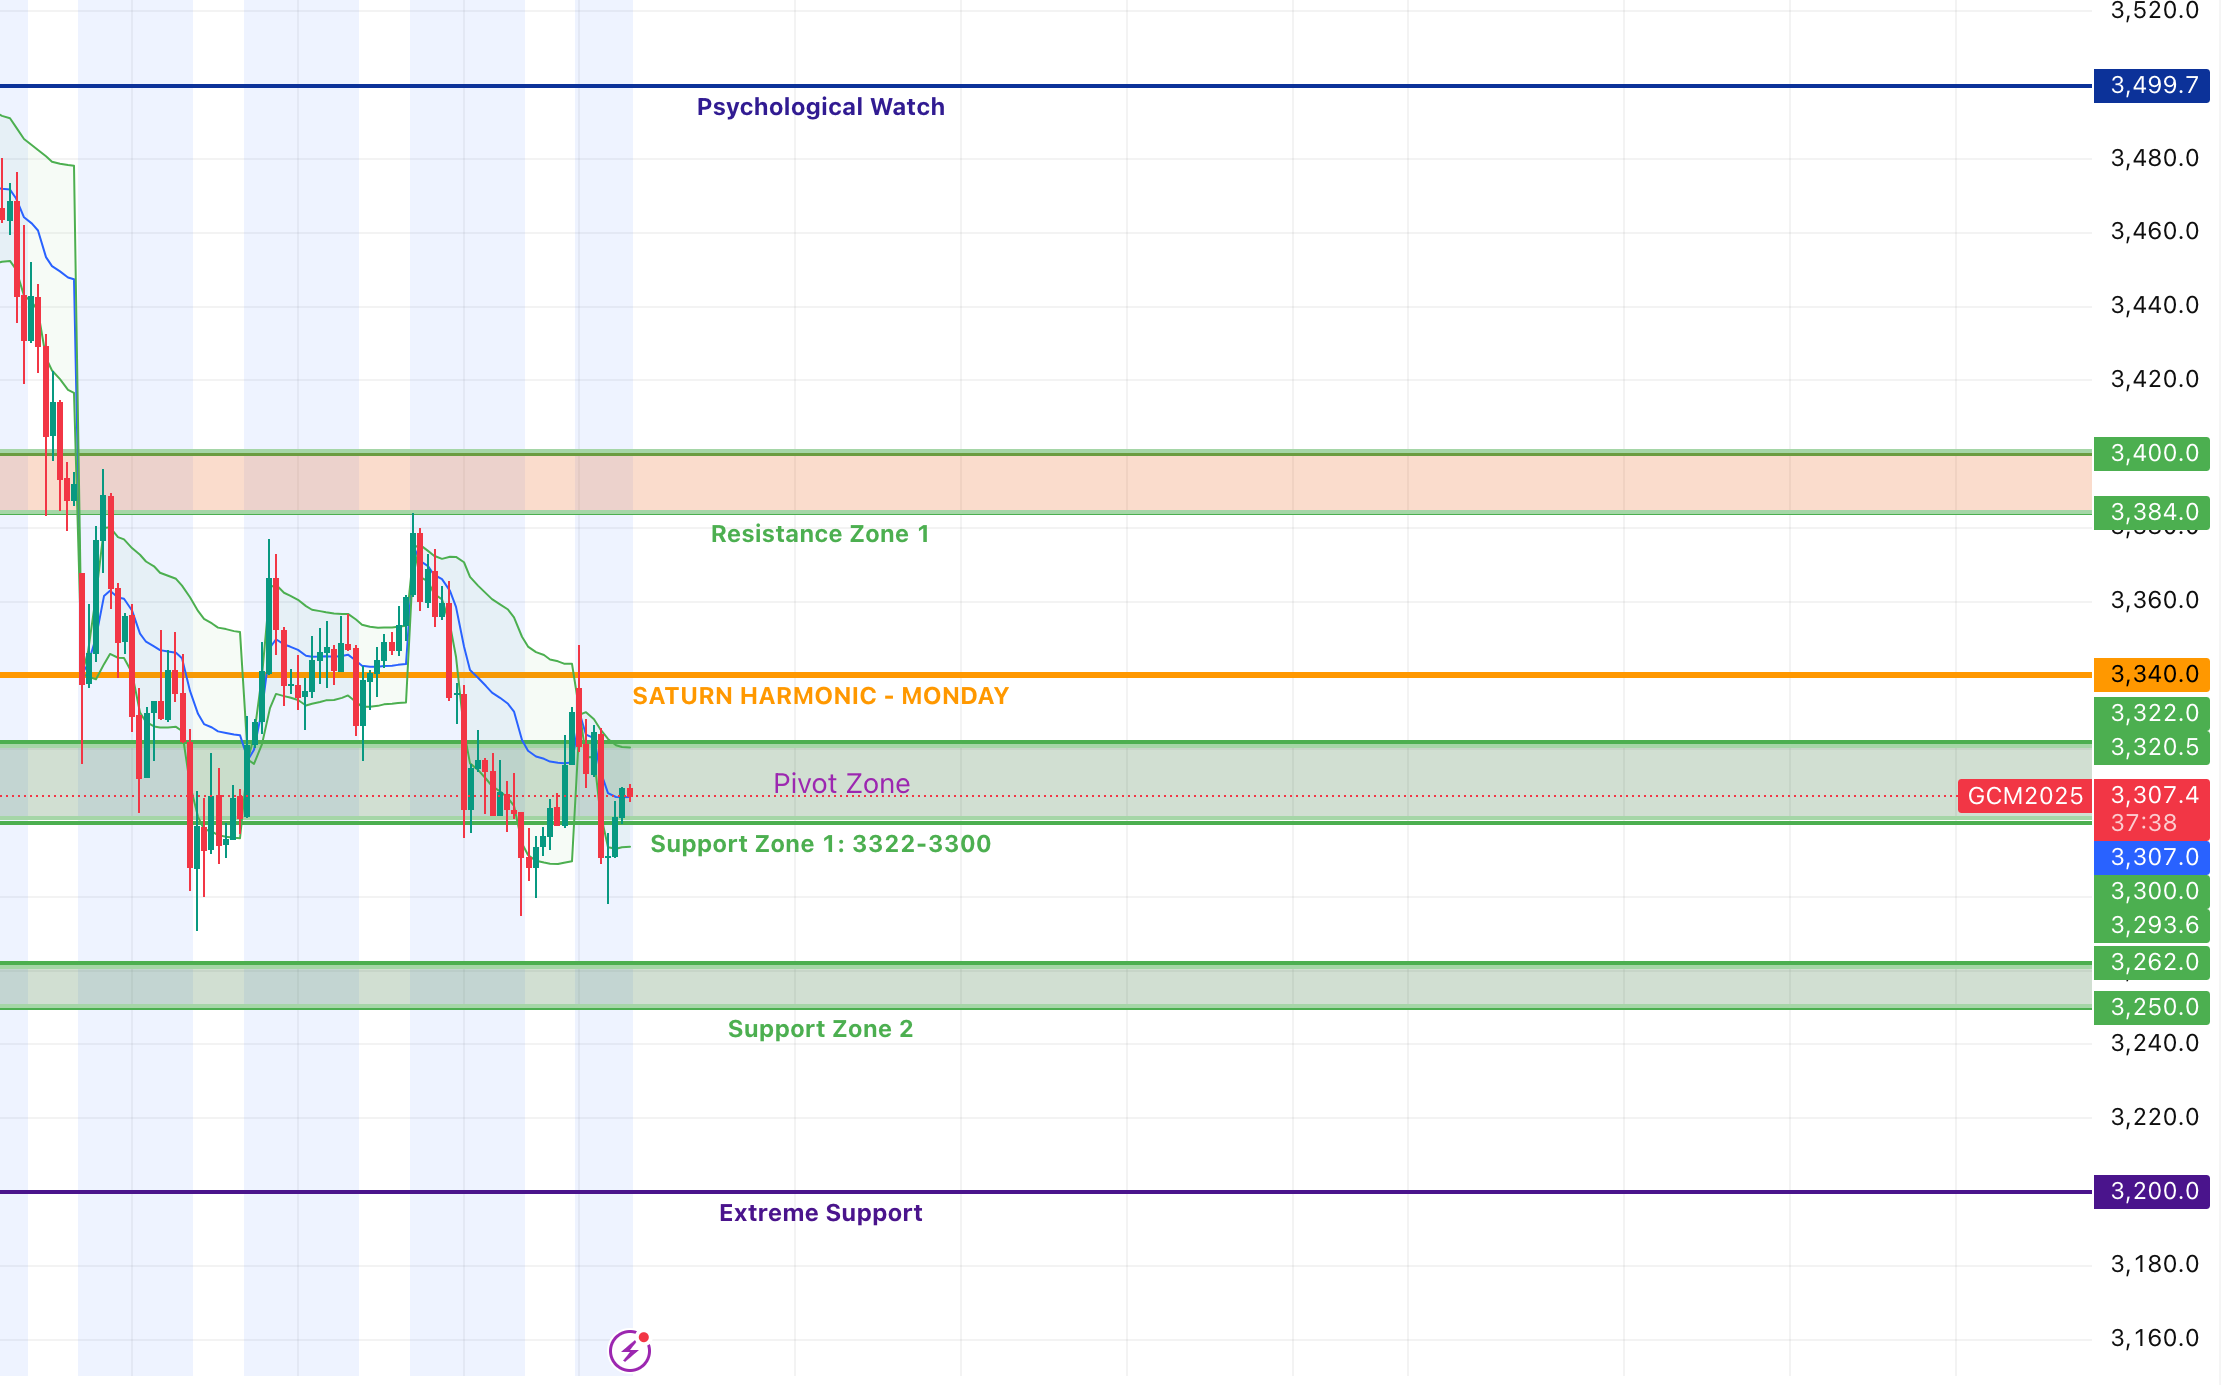
Support Zone 1: 3322-3300 (Options + Gann)
Saturn Harmonic: 3340
Support Zone 2: 3262-3250
Resistance Zone 1: 3384-3400
Psychological Watch: 3499-3500
Extreme Scenario: 3200 (deep flush support)

Closing Personal Forecast

The alignment of Gann Square of 9 projections, heavy open interest, and Saturn’s cosmic positioning creates an extraordinary “harmony of pressure” in the gold market this week.

Whichever side gains control around 3300-3340 will likely dictate the trend for the next two weeks.

S&P 500 Futures Weekly: Personal Forecast (April 28 – May 2, 2025)

(April 28 – May 2, 2025)


Introduction

As we head into the final trading days of April and open the door to May, the S&P 500 futures (ES) are coming off a sharp rally from the April 24th swing low at 5127. Fueled by bullish momentum, technical breakouts, and favorable options positioning, ES now trades around 5549-5550.

But with price pressing into critical overhead resistance zones derived from both Options Open Interest and Square of 9 projections, this week becomes a tactical battlefield.

This is my personal forecast and workbook to prepare for every scenario: where I expect price to move, where to press advantage, and where to defend profits.


Big Picture Outlook

Momentum remains bullish early this week. The strong push above the key 5440-5450 zone and the 5527 Square of 9 180° target validates bullish control.

However, the market now approaches the last “clean air” zone between 5527 and 5600-5615, where major options walls and Square of 9 resistance converge. This suggests the probability of a more volatile, indecisive environment as we get deeper into the week.

Staying tactical and emotionless will be critical.

ES SP500 Numerology Square of 9 Predictions

Most Important Levels This Week

Option Open Interest Walls:

  • 5450 — Huge put/call wall (prior battleground)
  • 5500 — Minor psychological level
  • 5600 — Heavy call wall resistance
  • 5700 — Final psychological/options ceiling

Square of 9 Levels (based only on April 24 swing low at 5127):

  • 5527 — 180° up (already tagged Friday)
  • 5615 — 270° up (next major resistance magnet)
  • 5356 — Key structural support if momentum fails

My Personal Trading Map

Primary Gameplan:

ScenarioMy Move
Above 5527Stay tactical long, targeting 5600-5615
Between 5550-5600Press advantage lightly, be ready for fast moves
Into 5600-5615Scale out, reduce risk, and look for exhaustion
Above 5615Small speculative long toward 5700 if volume supports
Breakdown below 5527Flip to cautious; risk retests of 5500/5440
Breakdown below 5440Flip to full defensive posture; target 5398/5356

Timing Windows:

  • Monday-Tuesday: Likely continuation push attempt (low volume = easier trend maintenance)
  • Wednesday-Thursday: High risk of major volatility; watch if topping starts around 5600+
  • Friday: Likely profit-taking window or trend reversal catalyst

Emotional Strategy

This week isn’t about predicting every tick. It’s about:

  • Staying long while momentum is strong.
  • Scaling out methodically at known resistance (especially 5600-5615).
  • Being emotionally ready to flip defensive if the market shows exhaustion signals.

The key lesson from this week is not to be greedy at the top.

Visual Cheat Sheet

Current: ~5549-5552
UP Target: 5600-5615 (take profits aggressively)
Extreme UP: 5700 (only if 5615 breaks with strength)
Warning if under 5527
Sell signal if under 5440

Closing Personal Forecast

This is the stage of the rally where the best money is often made — and often lost — based purely on discipline.

I expect a potential “melt-up” early in the week toward 5600-5615. After that, serious caution is needed.

My motto this week:

“Respect momentum early. Respect exhaustion later.”

Good luck and good discipline to everyone trading ES this week.

Price = Time = Degrees: A Personal Study on Market Structure

When studying the movement of markets, one principle becomes impossible to ignore:

Price, Time, and Degrees are different faces of the same underlying energy.

Markets breathe, pulse, and rotate according to natural cycles.
To understand them, we cannot think in only one dimension.
Price, Time, and Degrees are fully connected — and measurable.


Core Concept: Price = Time = Degrees

  • Price is the visible distance markets travel.
  • Time is the invisible cost required for movement.
  • Degrees measure the rotational energy beneath the surface.

Every major trend or reversal can be measured:

  • In how much price changed,
  • In how much time passed,
  • In how many degrees of vibrational energy completed.

When time and price match harmonically by degree,
markets reach decision points — and trends either accelerate or reverse.


How Degrees Measure Time

  • 360 degrees = One complete cycle.
  • 45 degrees = 1/8 of a full cycle (minor shift).
  • 90 degrees = 1/4 cycle (key inflection point).
  • 180 degrees = 1/2 cycle (major polarity change).
  • 360 degrees = Full cycle exhaustion.

Markets respect these angles in both price and time.
The key is realizing time itself can be broken into degrees based on the chart timeframe.

  • On a daily chart: 1 bar = 1 day.
  • On a 1-minute chart: 1 bar = 1 minute.
  • On a 5-minute chart: 1 bar = 5 minutes.

No matter the timeframe, time progresses in measurable degrees.


How to Apply Price = Time = Degrees

1. Define the Unit of Time

  • Know whether you are on a daily, hourly, 5-minute, or 1-minute chart.

2. Identify a Significant Pivot

  • Start from a major low, high, or trend beginning.

3. Project Degree Cycles Forward

Move outward in multiples of 45°:

  • After 45 bars → Minor reaction expected.
  • After 90 bars → Potential trend shift.
  • After 180 bars → Major exhaustion or reversal.

Each bar is a unit of time — and also a slice of vibrational rotation.

4. Confirm with Price and Volume

  • If time and price complete vibrational cycles together,
    the probability of a market reaction increases sharply.

Example on the Daily Chart

  • A major low forms at 4000.
  • Each bar = 1 day.

Cycle Checkpoints:

  • 45 days after the low: Minor reaction expected.
  • 90 days after the low: Watch carefully for acceleration or pullback.
  • 180 days after the low: Major decision window.

If price rallies 180 points in 180 days,
Price = Time = Degrees are all in balance —
the energy cycle is complete.


Example on the 1-Minute Chart

  • On a 1-minute chart, each bar = 1 minute.
  • A short-term low forms at 4200.

Cycle Checkpoints:

  • 45 minutes later (45 bars): Minor intraday reaction likely.
  • 90 minutes later: Possible trend reversal.
  • 180 minutes later: Full intraday exhaustion expected.

Whether it’s 1 minute or 1 day,
time can be measured in degrees to find where markets naturally shift.


Summary

Price is the distance traveled.
Time is the cost of travel.
Degrees are the measurement of energy rotation.

They are not separate forces.
They are parts of the same system.

By studying how they interact,
trends and reversals become visible long before they occur.

Markets do not move randomly.
They move by law — and law is measurable.

Applying the Square of 9 – Article

Applying the Square of 9: Finding Significant Price Levels

Square of 9 Trading: Structure, Origins, and Application

The Square of 9 is one of the clearest tools for understanding the hidden structure behind market movements.
Developed from ancient mathematical ideas and adapted by W.D. Gann, it offers a disciplined method to measure the relationship between price, time, and vibration.

Markets do not move randomly.
They spiral and expand according to natural laws.
The Square of 9 captures this dynamic, allowing traders to project significant levels of support, resistance, and timing points.


The Historical Origins of the Square of 9

The concept behind the Square of 9 can be traced back to ancient Indian Vedic mathematics and early astronomical studies.
Numbers were arranged in spirals, mapping cycles in nature and the heavens.

W.D. Gann studied these ancient systems and applied them to modern financial markets.
He recognized that markets, like celestial bodies, moved according to laws of vibration, expansion, and cycle timing.

The Square of 9 became one of Gann’s core forecasting tools, helping him measure and anticipate price movements and time-based market turns with extraordinary precision.


Why Gann Used the Square of 9

Gann believed that price and time are inseparable.
He understood that all market movements are governed by natural harmonic law.

Rather than treating price and time as separate factors, Gann measured them together using rotation — not linear progression.
By plotting values through the Square of 9, he revealed when vibrational energy aligned, creating conditions for market reversals, accelerations, or consolidations.

In my work, I focus primarily on multiples of 45 degrees:

  • 45°, 90°, 135°, 180°, 225°, 270°, 315°, and 360°.
    Each of these angles represents a key energy point where price often reacts.

How to Apply the Square of 9 in Trading

1. Identify a Major Pivot

Select a significant high or low — a clear turning point where market direction changed decisively.

2. Locate the Base Value

Use the pivot price as your starting point.
Locate its position on the Square of 9.
You can manually plot it by calculating its square root, or use a Square of 9 calculator.

3. Project Harmonic Levels

Advance outward from the base value using multiples of 45 degrees:

  • A 45° move often marks a minor reaction or hesitation.
  • A 90° move frequently represents stronger support or resistance.
  • A 180° move can signal major reversals or accelerations.
  • A 360° move indicates full vibrational completion.

Each angle serves as a checkpoint where price is likely to respond.

4. Integrate Time Cycles

Timing greatly increases the accuracy of Square of 9 projections.
When price levels align with important time cycles or anniversaries, the likelihood of a reaction becomes much stronger.

5. Confirm with Volume and Structure

Overlay your projections with volume studies and structural analysis.
Volume confirmation ensures that a vibrational level is respected by market participants, improving the quality of your signals.


Recommended Tools for Square of 9 Trading

Manually calculating levels is possible but time-consuming.
For professional precision and speed, I recommend using Gannzilla software.

Gannzilla offers:

  • Exact Square of 9 calculation
  • Angle projections
  • Integrated time and price cycle tools

It is an essential tool for serious study and application of vibrational trading principles.


Why the Square of 9 Remains Relevant Today

Although technology and markets have evolved, human behavior has not.
The emotional rhythms driving price action remain the same.

Markets are moved by sentiment, and sentiment is governed by cycles.
By measuring these cycles through the Square of 9, traders can gain an advantage in anticipating when and where markets are likely to shift.

Spiraling vibration, not linear progression, defines real market movement.

The Square of 9 remains one of the few tools that reveal this hidden structure with clarity.


The Square of 9 is a measuring device — not a prediction tool.

By understanding vibration, time, and cause, the trader can anticipate effect.

Foundations: Time, Number, and the Movement of Markets

Foundations of Time Cycles Trading

This site serves as a structured record of my ongoing theories, research, and observations regarding the forces that govern financial markets.
The goal is clear: to study the movement of markets through the lens of time cycles, numerical vibration, human sentiment, and natural law.

Time Cycles Trading is built on one simple truth:
Markets are moved by people, and people are moved by cycles.


The Influence of Cycles on Market Behavior

It is not the mechanical movement of planets or the abstract presence of numbers that move markets directly. Instead, planetary cycles, numerical harmonics, and time periods act upon human emotions.
Through predictable shifts in collective sentiment, markets rise and fall.

Understanding market movement, therefore, requires understanding human behavior at scale.
Moreover, it demands recognition that human behavior is not random — it follows measurable, repeatable, and observable cycles over time.


Core Methods of Analysis

The theories and structures documented here incorporate several major disciplines:

  • Numerology: Identifying the vibrational patterns within time cycles and price structures.
  • Astrological Timing: Tracking emotional waves and sentiment shifts that impact mass behavior.
  • Sacred Geometry: Applying natural ratios, angles, and harmonic divisions to forecast price and time intersections.
  • Cycle Theory: Recognizing repeating sequences and momentum phases that drive market expansion and contraction.
  • Fundamental and Volume Analysis: Confirming cyclical and vibrational forecasts with real-world catalysts and participation measures.

By combining these tools, I aim to refine the accuracy of timing and positioning within modern financial markets.


Key Principles of Time Cycles Trading

The following principles form the foundation of my work:

  • Time governs price: Price action cannot be separated from the passage of time.
  • Cycles govern emotion: Collective sentiment shifts according to identifiable rhythms.
  • Numbers vibrate: Each number carries a signature that impacts time and price structures.
  • Markets reflect natural law: Every movement has a cause, and every cause has an effect.

By studying cause, one can anticipate effect.
Through correct measurement of time cycles and vibrational structures, major market moves become visible before they occur.


Purpose of This Research

This site is a live archive of theory development.
Every article reflects active study, ongoing testing, and disciplined documentation.
Time Cycles Trading is not presented as a finished product.
Rather, it is a growing exploration of how timeless principles apply within modern financial markets.

Over time, the goal is to refine and structure these theories into more complete systems, capable of anticipating movement across different market conditions.


Further Study

If you are interested in foundational materials on cycle theory, natural law, and market structure, consider exploring:

Internal content to explore:


Closing Reflection

Markets do not move by accident.
They move according to law: the law of time, the law of number, and the laws of human behavior under cyclical influence.

The serious student who masters time cycles trading will see what others ignore — and will act before the crowd reacts.


📚 The study begins here.